Tutorial: watch your whole HQ from the Command Center
Run enough agents and the question becomes “what’s actually happening?” The Command Center answers it on one board: who’s working, what it costs, which automations are healthy.
1. Open the board
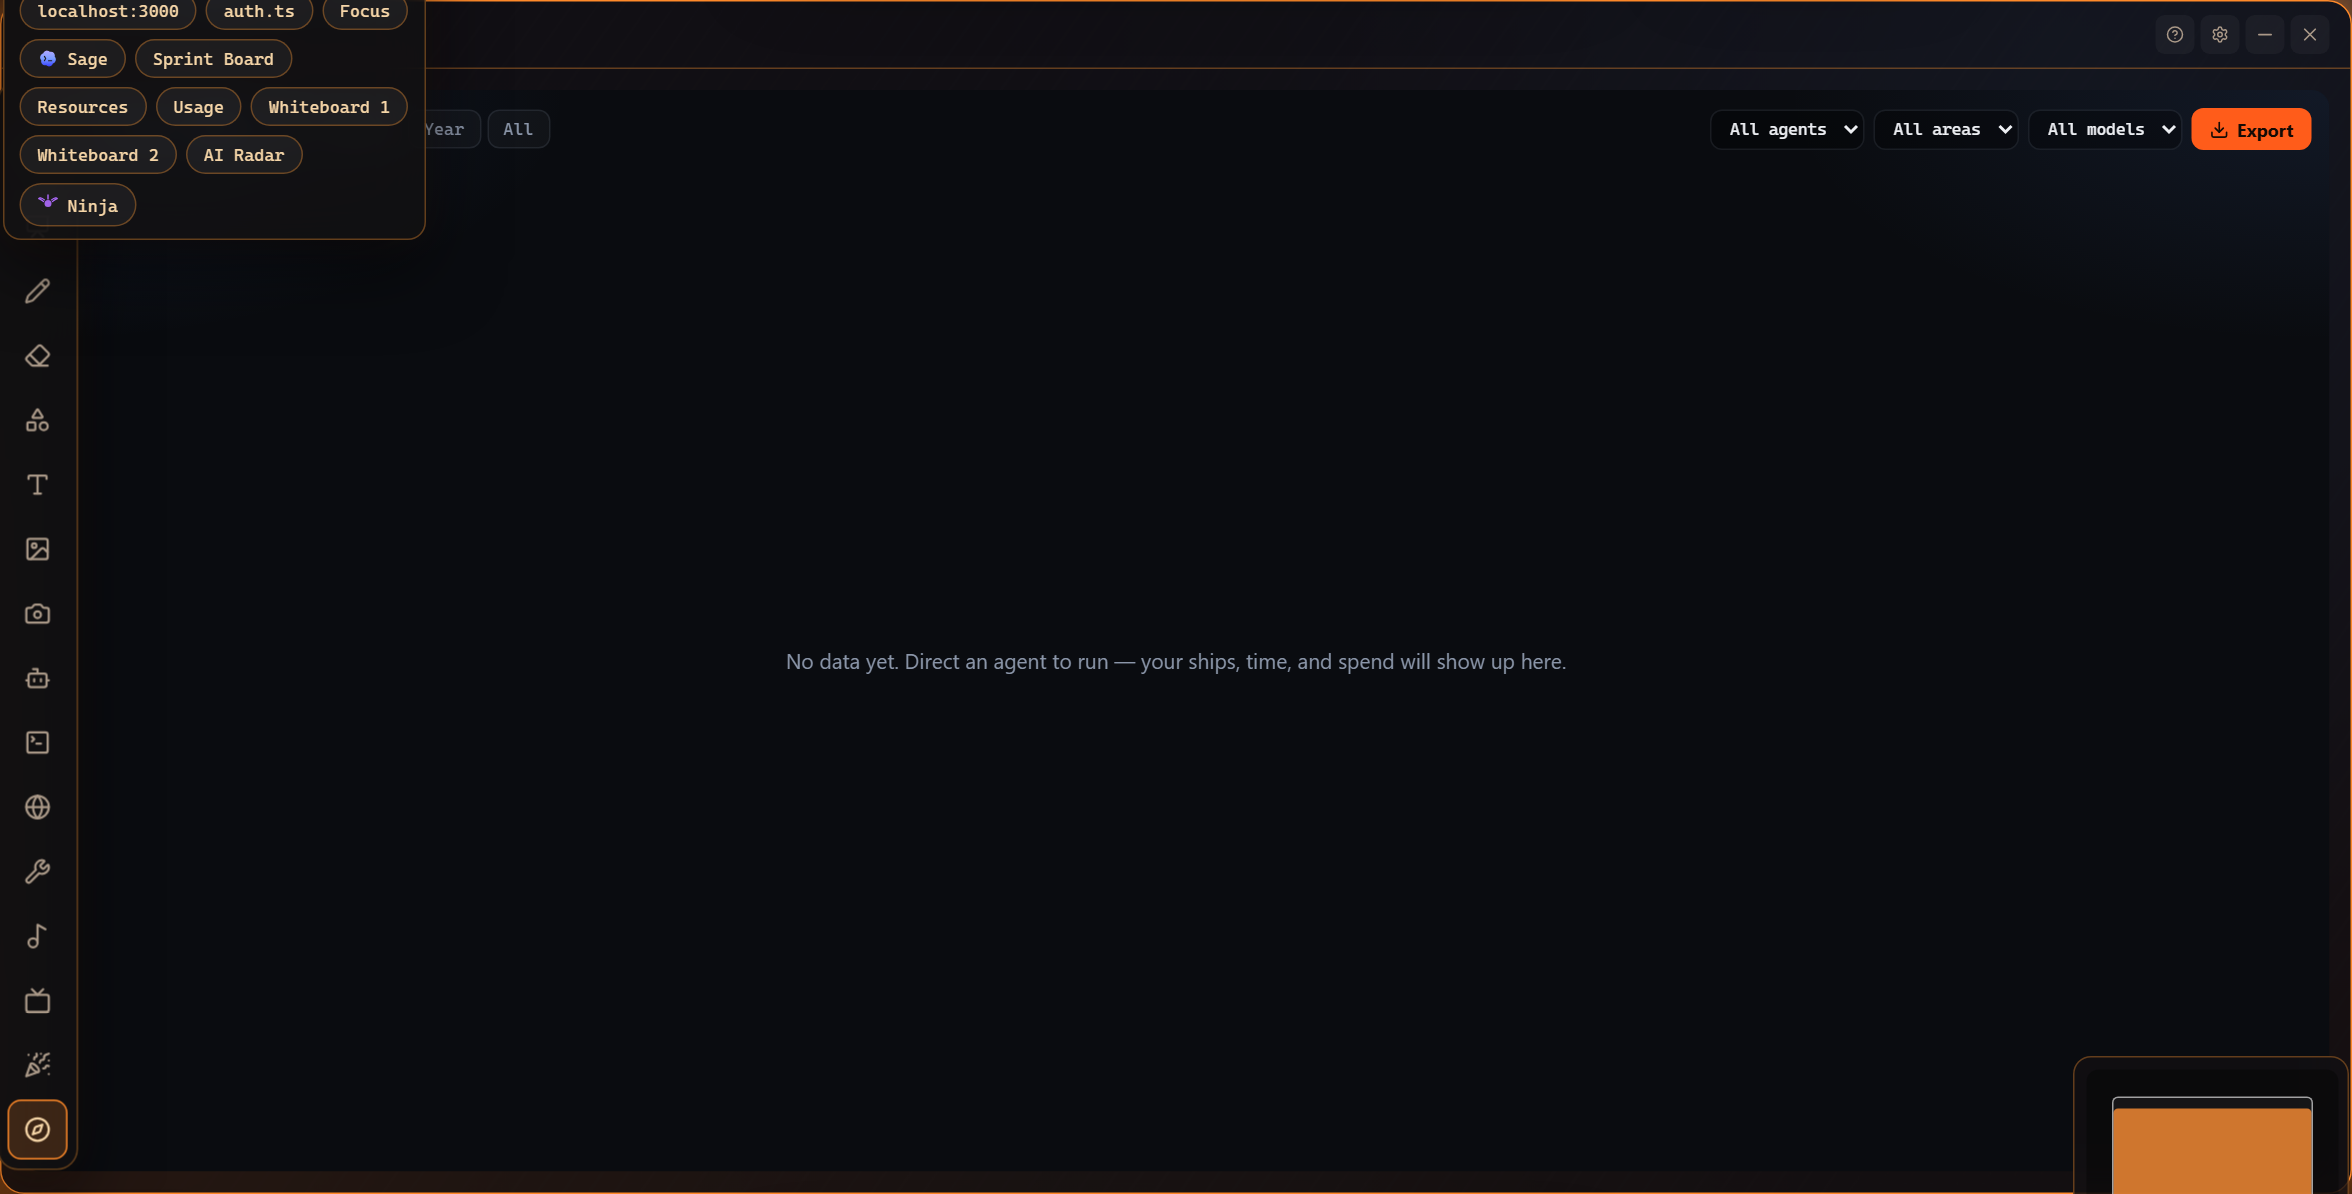
Section titled “1. Open the board”Tools → Dashboard:
2. Read it in ten seconds
Section titled “2. Read it in ten seconds”- Activity - runs by agent, today and over time, so a quiet agent or a runaway one stands out.
- Cost - token spend as money, by agent and by project. The “which agent is expensive” argument ends here.
- Automation - loops, council runs, and crew sprints with their outcomes, so unattended work stays visible.
3. Drill down when something looks off
Section titled “3. Drill down when something looks off”Panels link to their sources: usage details in the Usage pane, actions in the Audit Log, per-card history on the Sprint Board. The dashboard is the smoke alarm; those are the room-by-room inspection.
4. It grows with your HQ
Section titled “4. It grows with your HQ”Connected surfaces add live panels - a store’s revenue and licenses, for instance, appears as its own panel once its admin key is saved in Settings. Your HQ’s dashboard reflects your operation.
Where to go next
Section titled “Where to go next”- The Command Center - every panel explained.
- The Usage pane - per-agent, per-model detail.
- The Audit Log - the complete paper trail.
Frequently asked questions
Where do the numbers come from?
From your HQ itself - agent runs, loops, council and crew activity, benchmarks, and (if connected) live panels like the Store. Nothing is sent anywhere; it's your local telemetry.
Can I see spend per project?
Yes - the by-project panel groups cost and activity by the project a run belonged to.